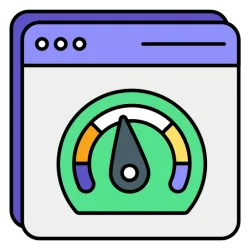
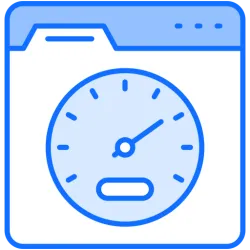
The Web Speed Test API is a tool designed to comprehensively analyze the performance and loading efficiency of any website. Its main objective is to offer a complete technical overview that covers both server behavior and end-user experience, providing accurate metrics and automated optimization recommendations.
The API works by running real-time tests on the specified URL, collecting key data such as HTTP response status, Time to First Byte (TTFB), total server load time, content size, number of requests made, and compression or cache availability. At the same time, it measures user experience parameters such as Largest Contentful Paint (LCP), First Input Delay (FID), Cumulative Layout Shift (CLS), and total full load time, generating an overall performance score that summarizes the site's efficiency.
One of the most notable features of this API is its ability to automatically detect performance issues and offer specific solutions. Each identified issue, such as a high LCP or FID, is accompanied by a list of technical recommendations—for example, image optimization, JavaScript deferral, or CDN cache activation.
Analyzes website performance by measuring server-client metrics and generating JSON reports with detected issues and optimization suggestions.
Get Test - Endpoint Features
| Object | Description |
|---|---|
url |
[Required] Enter a URL |
                                                                                                                                                                                                                                                                                                                                        {
    "url": "https:\/\/www.google.com",
    "status_code": 200,
    "server_metrics": {
        "ttfb_ms": 92.75,
        "server_load_time_ms": 105.07,
        "content_size_kb": 49.5,
        "request_count": 1,
        "compression_enabled": false
    },
    "client_metrics": {
        "lcp_ms": 2838.5,
        "cls": 0,
        "fid_ms": 60,
        "full_load_time_ms": 2846,
        "performance_score": 93
    },
    "issues": [
        "High Largest Contentful Paint (LCP: 2838.5 ms)"
    ],
    "optimization_suggestions": [
        {
            "issue": "High LCP",
            "solution": "Use Cloudflare Polish to optimize images and enable WebP. Enable Rocket Loader to defer JavaScript. Use Cloudflare's CDN to cache static assets."
        }
    ],
    "VT": "xs5Jdk"
}
curl --location --request GET 'https://zylalabs.com/api/11238/web+speed+test+api/21242/get+test?url=https://www.google.com' --header 'Authorization: Bearer YOUR_API_KEY'
| Header | Description |
|---|---|
Authorization
|
[Required] Should be Bearer access_key. See "Your API Access Key" above when you are subscribed. |
No long-term commitment. Upgrade, downgrade, or cancel anytime. Free Trial includes up to 50 requests.
The API returns a comprehensive JSON report that includes server metrics (like TTFB and server load time), client metrics (such as LCP and FID), detected performance issues, and optimization suggestions tailored to improve website efficiency.
Key fields include `url`, `status_code`, `server_metrics` (with TTFB, server load time, content size, request count, and compression status), `client_metrics` (including LCP, CLS, FID, full load time, and performance score), `issues`, and `optimization_suggestions`.
The response is structured in a JSON format, with separate sections for server metrics, client metrics, identified issues, and optimization suggestions, making it easy to parse and utilize for performance analysis.
The API provides information on server-client performance metrics, user experience metrics, detected performance issues, and actionable optimization suggestions to enhance website loading efficiency.
Users can customize requests by specifying the URL they want to analyze. The API automatically runs tests on the provided URL and returns relevant performance metrics and suggestions based on the analysis.
Typical use cases include website performance optimization, troubleshooting loading issues, enhancing user experience, and generating reports for web developers or stakeholders to improve site efficiency.
Data accuracy is maintained through real-time testing of the specified URL, ensuring that metrics reflect current server-client interactions. The API employs standard web performance measurement techniques to ensure reliable results.
Users can expect patterns such as high TTFB indicating server delays, high LCP suggesting slow content loading, and specific optimization suggestions based on identified issues, allowing for targeted improvements.
The API analyzes server metrics such as Time to First Byte (TTFB), server load time, content size, request count, and compression status. It also evaluates client metrics including Largest Contentful Paint (LCP), Cumulative Layout Shift (CLS), First Input Delay (FID), full load time, and provides an overall performance score.
The performance score, ranging from 0 to 100, summarizes the website's efficiency. A higher score indicates better performance, while a lower score suggests potential issues that may need addressing, such as slow loading times or poor user experience metrics.
The API offers tailored optimization suggestions based on identified issues. Examples include image optimization techniques, JavaScript deferral strategies, and enabling CDN caching to enhance loading efficiency and improve user experience.
The API is designed to analyze any publicly accessible URL, regardless of the website's technology stack. It provides relevant metrics and suggestions based on the specific performance characteristics of the analyzed site.
Detected issues highlight specific performance bottlenecks, such as high LCP or FID values. Addressing these issues is crucial for improving user experience and overall site performance, as they directly impact how quickly users can interact with the content.
Users can implement the optimization suggestions provided in the API response to address specific performance issues. For instance, if the API suggests enabling compression, users can configure their server settings accordingly to reduce content size and improve load times.
Real-time testing ensures that the metrics reflect the current performance of the specified URL. This approach captures live server-client interactions, providing accurate and actionable insights for performance optimization.
Yes, the API can be integrated into continuous monitoring systems. By regularly analyzing a website's performance, users can track improvements over time and quickly identify new issues as they arise, ensuring optimal user experience.
Zyla API Hub is like a big store for APIs, where you can find thousands of them all in one place. We also offer dedicated support and real-time monitoring of all APIs. Once you sign up, you can pick and choose which APIs you want to use. Just remember, each API needs its own subscription. But if you subscribe to multiple ones, you'll use the same key for all of them, making things easier for you.
Service Level:
100%
Response Time:
10,604ms
Service Level:
100%
Response Time:
527ms
Service Level:
100%
Response Time:
10,646ms
Service Level:
100%
Response Time:
12,041ms
Service Level:
100%
Response Time:
20,003ms
Service Level:
100%
Response Time:
779ms
Service Level:
100%
Response Time:
1,440ms
Service Level:
100%
Response Time:
11,821ms
Service Level:
100%
Response Time:
1,151ms
Service Level:
100%
Response Time:
5,878ms
Service Level:
100%
Response Time:
1,384ms
Service Level:
100%
Response Time:
53ms
Service Level:
100%
Response Time:
6,613ms
Service Level:
100%
Response Time:
67ms
Service Level:
100%
Response Time:
5,655ms
Service Level:
100%
Response Time:
1,439ms
Service Level:
100%
Response Time:
5,617ms
Service Level:
100%
Response Time:
53ms
Service Level:
100%
Response Time:
79ms
Service Level:
100%
Response Time:
55ms